Numba JIT benchmark and example
This is an extended answer to a test question that made me test out the results afterwards.
Numba is an JIT compiler for a subset of Python and Numpy that allows boosting the execution of some phython functions.
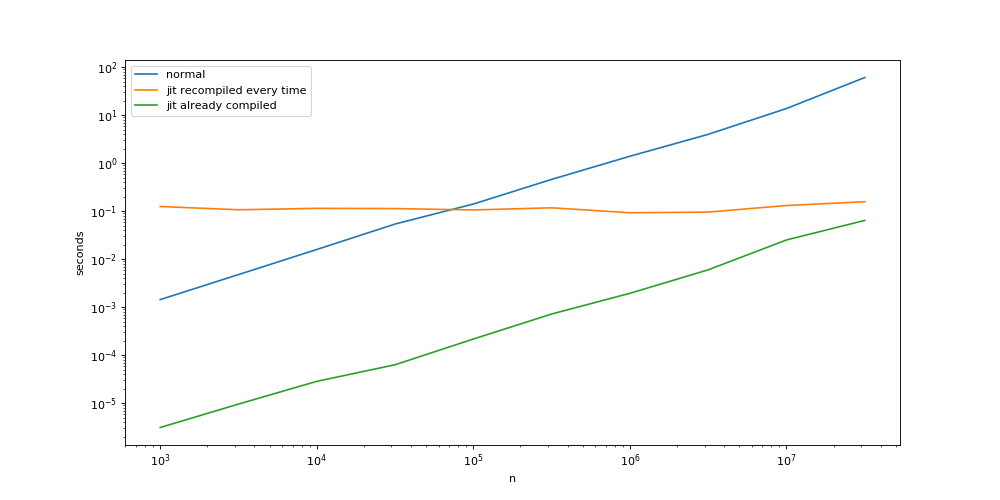
To try out how much performance improvement is possible, I compared a simple mathematical function with the same function, but prepended with the @njit decorator, that instructs numpy to compile the function the first time it has been executed.
Afterwards I run the function with to , record the timing and plot it with Matplotlib.
As one can see above with the compiled function (orange) is 100 times slower than a normal execution (blue) because the compilation on the first function call takes about . But if we ignore the time of the first compilation (because the function is already compiled), then the JIT-compiled function (green) is always 100 times faster than a normal python function.
from time import time

import numpy
from matplotlib import pyplot as plt
from numba import njit

def testfunction(v):
    n = 0
    for i in range(v.shape[0]):
        if v[i, 0] * v[i, 0] + v[i, 1] * v[i, 1] + v[i, 2] * v[i, 2] < 1:
            n += 1
    return n / v.shape[0]

@njit
def testfunction_jit(v):
    n = 0
    for i in range(v.shape[0]):
        if v[i, 0] * v[i, 0] + v[i, 1] * v[i, 1] + v[i, 2] * v[i, 2] < 1:
            n += 1
    return n / v.shape[0]

normal = []
mit_jit = []
mit_jit_compiled = []
ns = []

testfunction_jit(numpy.random.rand(3, 3))  # precompile

for i in range(6, 16):
    n = int(10 ** (i / 2))
    ns.append(n)
    x = numpy.random.rand(n, 3)

    start = time()
    result = testfunction(x)
    end = time()
    normal.append(end - start)
    print(result * 6)

    start = time()
    testfunction_jit.recompile()
    result = testfunction_jit(x)
    end = time()
    mit_jit.append(end - start)

    start = time()
    result = testfunction_jit(x)
    end = time()
    mit_jit_compiled.append(end - start)
    print(result * 6)

my_dpi = 80
plt.figure(figsize=(1000 / my_dpi, 500 / my_dpi), dpi=my_dpi)
plt.loglog(ns, normal, label="normal")
plt.loglog(ns, mit_jit, label="jit recompiled every time")
plt.loglog(ns, mit_jit_compiled, label="jit already compiled")
plt.xlabel("n")
plt.ylabel("seconds")
plt.legend()
plt.savefig('my_fig.png', dpi=my_dpi)
plt.show()